Positioning for the Future | 61
Performance Overview
Despite the headwinds in the residential market,
CapitaLand Group achieved a promt after tax and
non-controlling interests (PATMI) of S$1,160.8 million
for the full year ended 2014 (FY 2014), 38.2% higher
than FY 2013. Renecting the strength of our underlying
businesses, the Group’s operating PATMI grew 40.4% to
S$705.3 million. The signimcant improvement in FY 2014
performance was driven by promt recognition for the sale
of Westgate Tower, improved operating performance
driven by our shopping mall business, development
projects in 7ietnam and higher fair value gains from the
revaluation of the Group’s investment properties.
Revenue
Revenue for FY 2014 was S$3.9 billion which was 11.8%
higher than FY 2013. The increase was fuelled by the
sale of all of the ofmce strata units in Westgate Tower,
higher contribution from the shopping mall and serviced
residence businesses as well as our development
projects in 7ietnam. The increase was partially offset
by the lower revenue from our development projects
in China. Geographically, the Group’s core markets
of Singapore and China contributed about 76.7% or
S$3.0 billion of the Group’s revenue.
CapitaLand Singapore’s revenue of S$1,241.5 million was
comparable to that of FY 2013. The main contributors to
FY 2014 revenue were from its proportionate share of
revenue from the sale of Westgate Tower, Sky Habitat,
Sky 7ue and rental income from CapitaCommercial Trust,
Bedok Mall and Westgate.
Revenue from CapitaLand China decreased by 29.1% to
S$637.5 million in FY 2014 as the units handed over to
home buyers in the prior year were from projects that have
higher average selling prices, in particular, The Paragon.
In FY 2014, revenue was recognised for the units sold
and handed over for La Cite in Foshan, The Metropolis
in Kunshan, iPark in Shenzhen and International Trade
Centre in Tianjin.
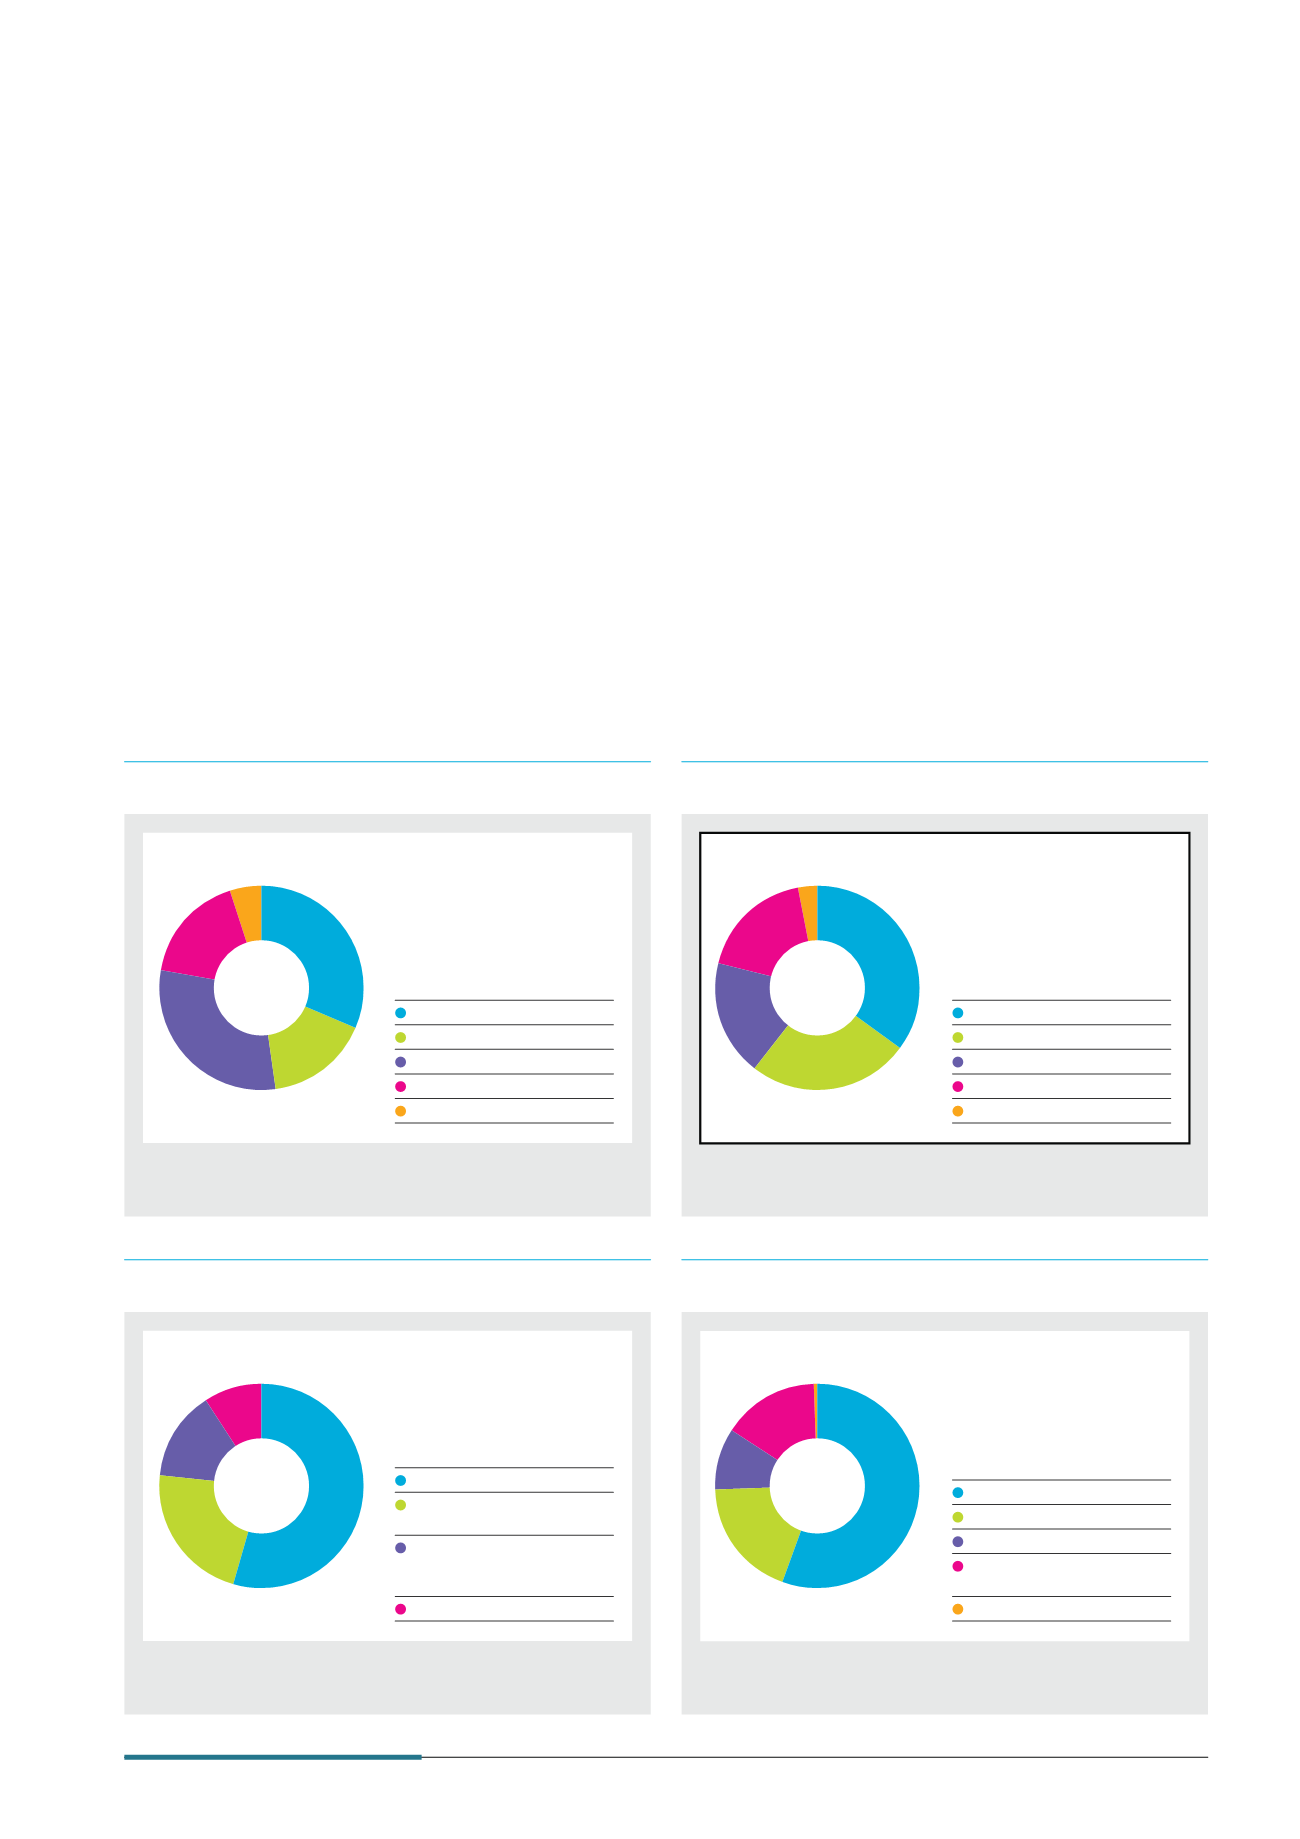
5HYHQXH E\ *HRJUDSKLFDO /RFDWLRQ
2014 Revenue by Strategic Business Unit
2014 Revenue by Business Type
2013 Revenue by Strategic Business Unit (Restated)
%
Singapore
54.7
China
(including Hong Kong) 22.0
Other Asia
(excluding Singapore
and China)
14.2
Europe and Others
9.1
%
CapitaLand Singapore 31.6
CapitaLand China
16.2
CapitaMalls Asia
30.0
The Ascott Limited
17.4
Corporate and Others
4.8
%
CapitaLand Singapore 35.2
CapitaLand China
25.6
CapitaMalls Asia
18.2
The Ascott Limited
18.1
Corporate and Others
2.9
%
Trading of properties
56.1
Rental and related income 19.0
Fee income
9.6
Serviced residence rental
and related income
15.2
Others
0.1
S$3.9b
S$3.9b
S$3.9b
S$3.5b
Business Review


